Note
Go to the end to download the full example code.
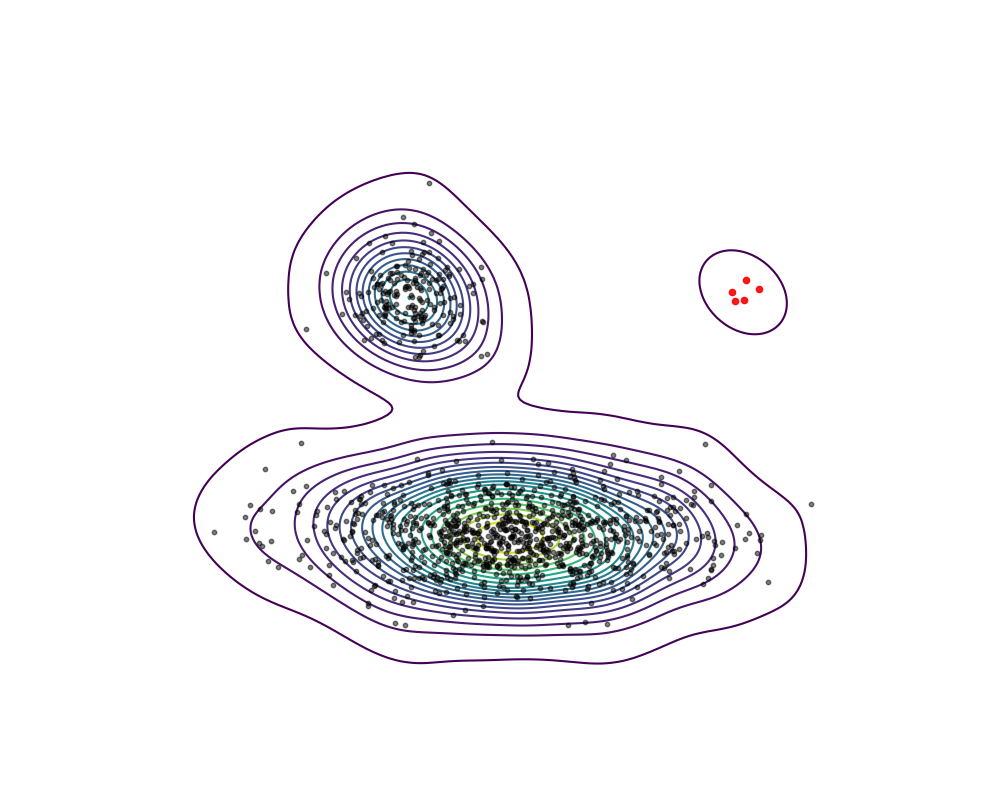
Multi-Modal Densities
Plot samples and density estimates for a multi-modal density.
import numpy as np
import matplotlib.pyplot as plt
import seaborn as sns

# Generate synthetic data from a complex multi-modal distribution
np.random.seed(42)
data = [
    np.random.normal(loc=[2, 2], scale=[0.2, 0.2], size=(5, 2)),
    np.random.normal(loc=[-3, 2], scale=[0.5, 0.5], size=(200, 2)),
    np.random.normal(loc=[-1.5, -2], scale=[1.5, 0.5], size=(1000, 2)),
]
all_data = np.vstack(data)

# Create a scatter plot of the data points
plt.figure(figsize=(10, 8))
sns.kdeplot(x=all_data[:, 0], y=all_data[:, 1], fill=False, cmap="viridis", levels=20, thresh=.01)
for i, d in enumerate(data):
    if i == 0:
        s, c, a = 20, 'red', 0.9
    else:
        s, c, a = 10, 'black', 0.5
    plt.scatter(d[:, 0], d[:, 1], s=s, c=c, alpha=a, zorder=10)
plt.axis('off')
plt.show()
Total running time of the script: (0 minutes 1.680 seconds)