Note
Go to the end to download the full example code.
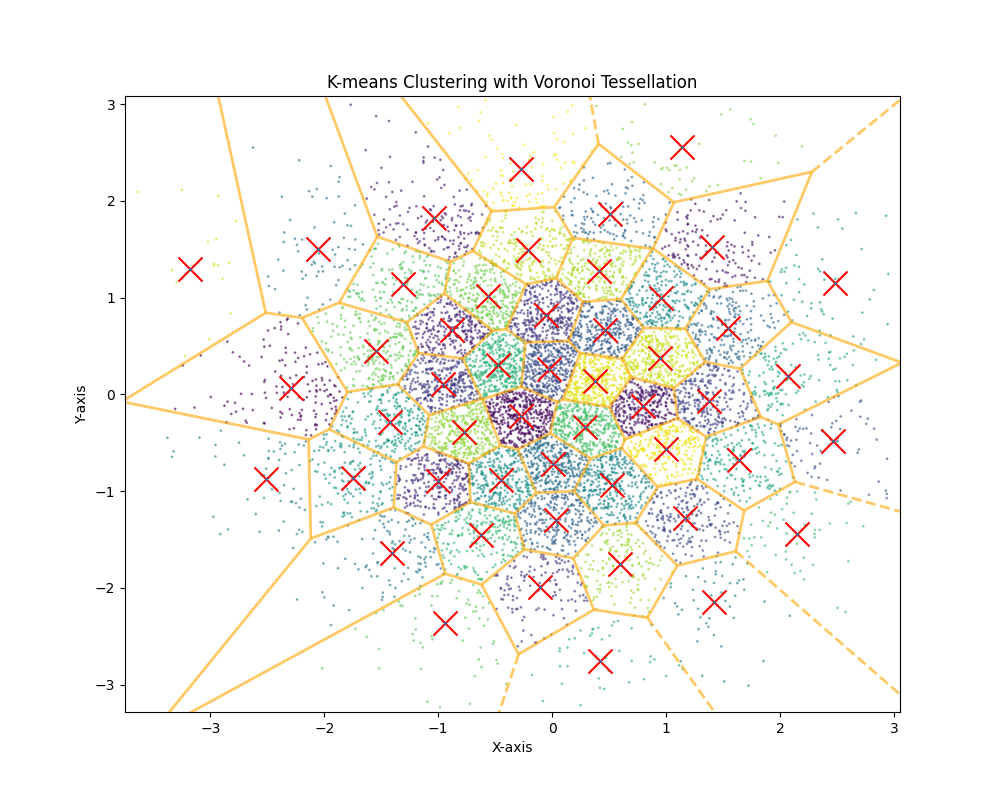
Voronoi Decomposition
Perform a Voronoi decomposition of a point cloud.
import numpy as np
import matplotlib.pyplot as plt
from sklearn.cluster import KMeans
from scipy.spatial import Voronoi, voronoi_plot_2d

# random data
data = np.random.randn(10000, 2)

# number of clusters
k = 50

# k-means clustering
kmeans = KMeans(n_clusters=k)
kmeans.fit(data)

# Get the cluster centers
centers = kmeans.cluster_centers_

# Voronoi tesselation
vor = Voronoi(centers)

# Plotting the data points
plt.figure(figsize=(10, 8))
plt.scatter(data[:, 0], data[:, 1], s=1, c=kmeans.labels_, cmap='viridis', marker='o', alpha=0.5)

# Plot the cluster centers
plt.scatter(centers[:, 0], centers[:, 1], s=300, c='red', marker='x')

# Plot Voronoi tesselation
voronoi_plot_2d(vor, ax=plt.gca(), show_vertices=False, line_colors='orange', line_width=2, line_alpha=0.6, point_size=2)

# Set plot labels and title
plt.title('K-means Clustering with Voronoi Tessellation')
plt.xlabel('X-axis')
plt.ylabel('Y-axis')

# Show the plot
plt.show()
Total running time of the script: (0 minutes 0.448 seconds)